Jump to content


Maintaining Velocity PJAS Project Results

inversion lambchopz physics pjas velocity

  • Please log in to reply
17 replies to this topic

#1 LaMbChOpZ

LaMbChOpZ

    Lead Particle Physicist and Musical Orchestrator

  • 2812 posts

Posted 18 February 2012 - 09:47 PM

After researching, creating a poll on here to find the most popular inversions, testing has been completed and my results are now able to be displayed. I will say that yes, I do know my inversions aren't perfect, but they are based off of real inversions. You have to admit, they aren't half bad. I will say that the worst inversion to build was the Zero-G-Roll, taking me 6 hours today alone. You can see why in the photos.

Here are my inversions with their technical name and a number. The number relates to the popularity / how common it is to find on a roller coaster.

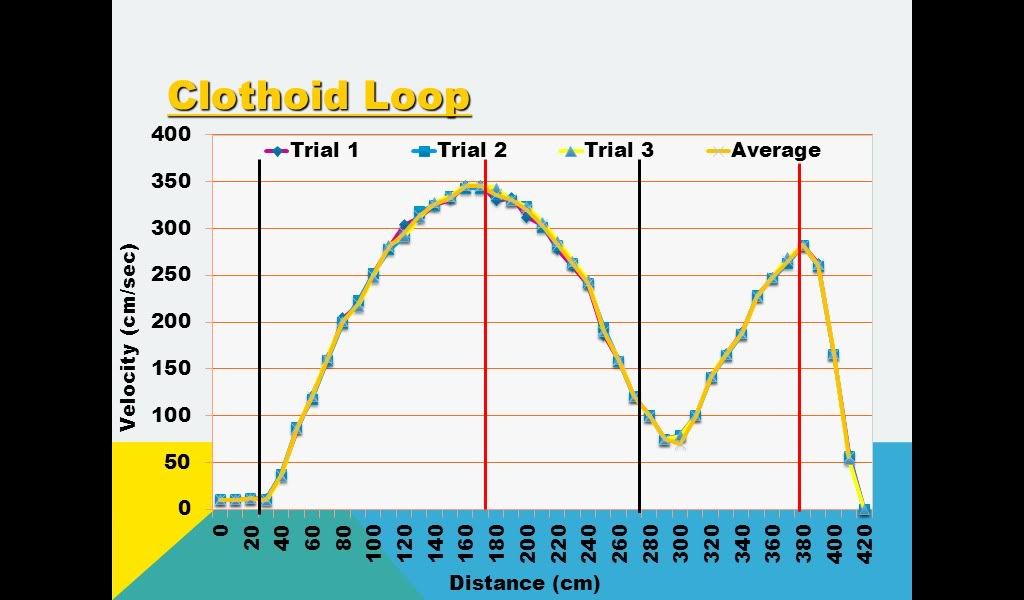
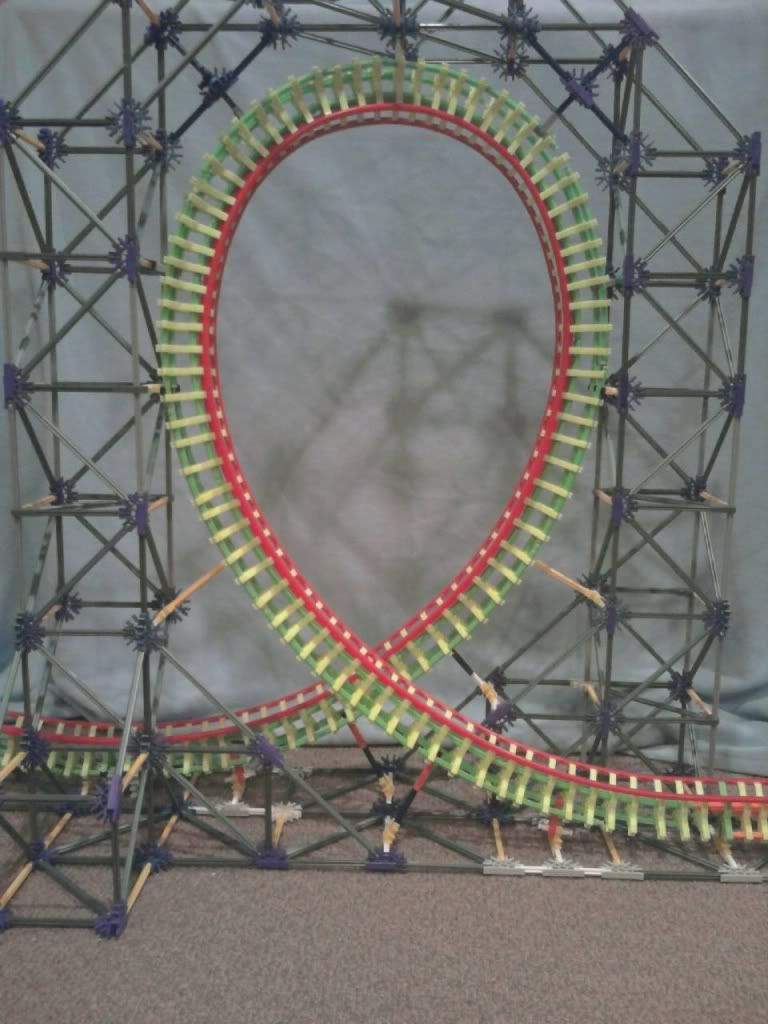
Inversion #1 - Clothoid Loop
Posted Image

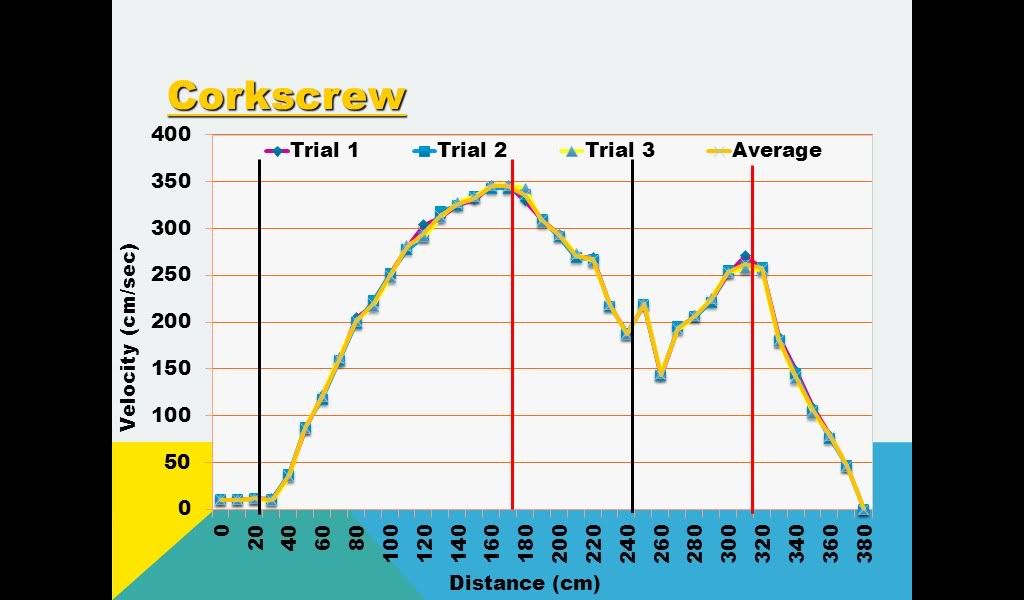
Inversion #2 - Corkscrew
Posted Image

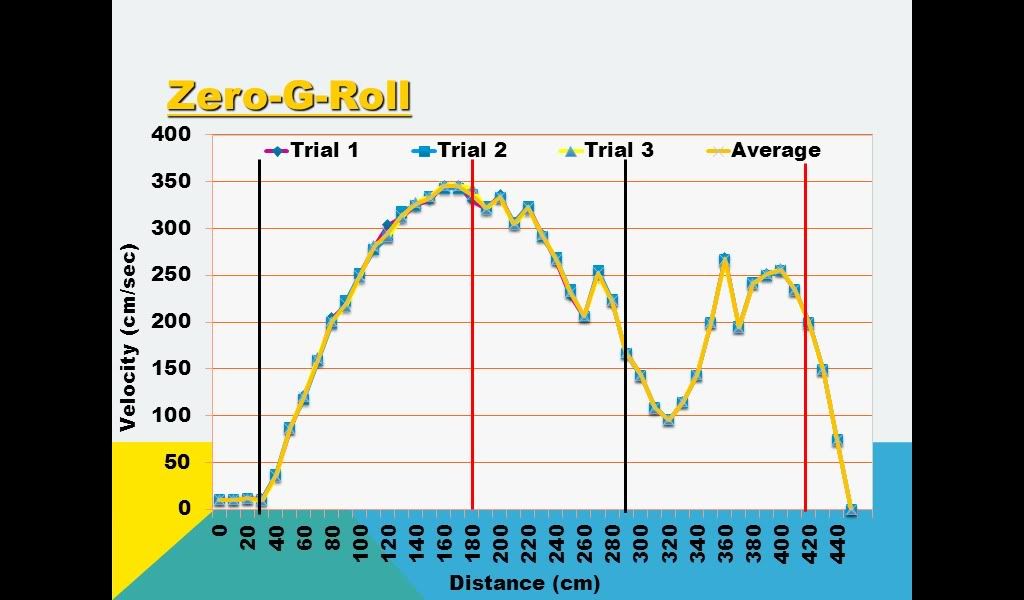
Inversion #3 - Zero-G-Roll
Posted Image

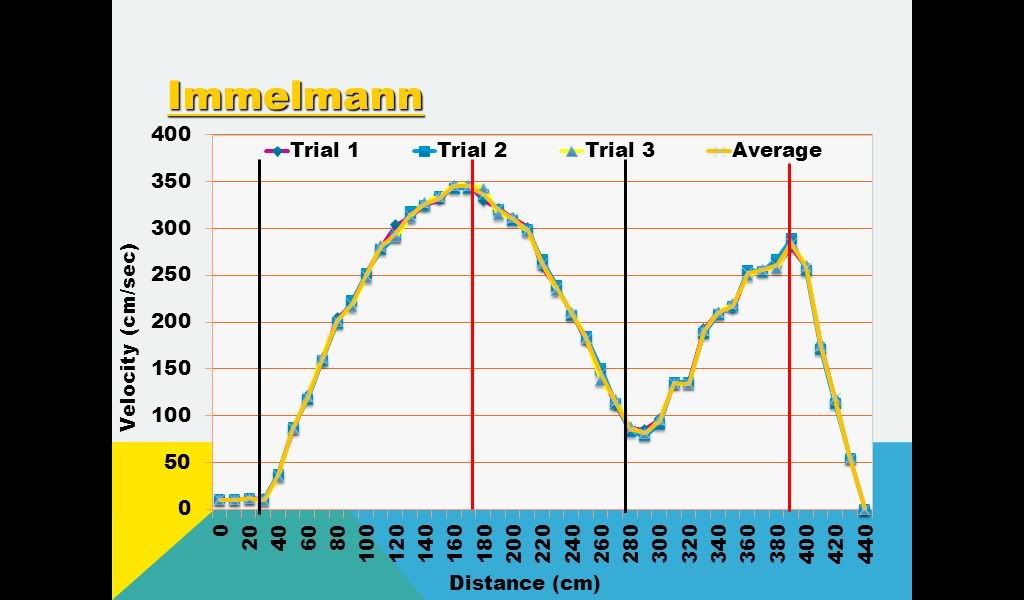
Inversion #4 - Immelmann
Posted Image


Again, not perfect, but my judges won't have any clue that there's anything wrong. They'll probably think, "oh wow, impressive." I spent so much time working on this, I'm happy to be done.


Results: In order of smallest difference to bigger difference in velocity for my inversions tested above, these are my results from the start of the inversion to the end of the inversion. Each inversion started with the same starting velocity of 345.40 cm/seconds).

  • Immelmann - 52.018 cm/seconds
  • Clothoid Loop - 54.36 cm/seconds
  • Corkscrew - 87.40 cm/seconds
  • Zero-G-Roll - 89.30 cm/seconds

However, I am still working on the Potential Energy and the Kinetic Energy of the Car at the top of the lift hill, bottom of the drop (start of inversion), the point of inverting, and the end of the inversion (start of brake run). I will edit these numbers below and they will be used to help finalize my results.


Maybe this will be able to help some of you figure out which type of inversions help maintain velocity for designing a layout. With the inversions tested, I found out inversions with little lateral (side to side) movement maintain a higher velocity. Other inversions create higher difference, resulting in a shorter layout. May seem like common sense, but science has helped to validate this point.

Member of a few physics experiments; Orchestrator and/or Copyist for a few musicals.


#2 Blackkitty

Blackkitty

    Meow!

  • 1705 posts

Posted 18 February 2012 - 11:33 PM

Well the 0-G Roll is not nearly supported compared to the other elements


#3 LaMbChOpZ

LaMbChOpZ

    Lead Particle Physicist and Musical Orchestrator

  • 2812 posts

Posted 18 February 2012 - 11:48 PM

It's filled with flexi's, 5 per crosstie. It held the car's weight and the force of the car, so there was no point over-supporting it, so I left it how it was.

Member of a few physics experiments; Orchestrator and/or Copyist for a few musicals.


#4 Jogumpie

Jogumpie

    Living through the great Gump hiatus...

  • 13586 posts

Posted 19 February 2012 - 07:29 AM

Since you're going scientific here, I am gonna be bitchy about two things.

1. It's not about "maintaining" speed/velocity. It's about preserving the energy. I am sure you know the concept of potential and kinetic energy, so it is just a matter of wording. If you would to maintain velocity, you could not have drops or hills, as they would change the velocity's magnitude and direction. It is the combination of kinetic and potential energy that would be maintained, if there was no friction. I think it is essential that you choose your words well.

2. A velocity is a measured in miles per hour, kilometer per hour, meter per second or any distance divided by time. You have incorrect units for your velocities. You actually have accelerations when you use m/s^2 instead of m/s. That's something that made me facepalm, since this mistake is quite shameful.

One of your velocities is 0.8930 m/s, which would be ~3.21 km/h, a speed gained by a 4 cm drop. That sounds about right. So if you'd just replace cm/s^2 by cm/s or rather m/s, you're good. It would be nice to plot the height / potential energy and the velocity / kinetic energy, and add those in a third plot to see the loss in energy. Then you can really see what is the worst for K'NEX coaster performance.


SSCoasters Administrator
The SSCoasters Forum Rules
DD_signature.jpg
YoutubeButton.pngFacebookButton.png


#5 LaMbChOpZ

LaMbChOpZ

    Lead Particle Physicist and Musical Orchestrator

  • 2812 posts

Posted 19 February 2012 - 12:20 PM

^ Yes the wording of "maintaing velocity" is a bit vague/unreal, but it is essentially what I am testing for. I'm also realizing my mistake with the velocity right now too. It isn't squared. I don't know why I thought it was.

I am going to graph the PE and KE at specific spots on the setup. Specifically, the apex of the lift hill, or the tallest part of the setup, the bottom of the drop / start of the inversion, the point of where the car is inverted, and the end of the inversion / start of the brake run. I'm going to make a whole separate graph, but I'm still deciding how I am going to display it. I'll figure it out soon.


EDIT: I'll look into converting the velocity into m/sec.

Here are the graphs of velocity for the inversions: Each different area represents different portions of my setup. First small section is the lift hill, followed by the 2nd section being the drop. The 3rd section is the 1st half of the inversion up until it inverts (the black ine), followed by the 2nd half of the inversion. Finally, the brake run is the final section. I'm measuring the differences from the 1st red line to the 2nd red line (start and end of inversion)

Posted Image

Posted Image

Posted Image

Posted Image

Member of a few physics experiments; Orchestrator and/or Copyist for a few musicals.


#6 alpal

alpal

    Lead Engineer

  • 1215 posts

Posted 19 February 2012 - 12:29 PM

Very interesting. They all look very similar.

Automation is my specialty
 

If only I had more space/pieces/time.


#7 Snake

Snake

    Construction Worker

  • 444 posts

Posted 19 February 2012 - 01:17 PM

How did you record the velocitys?


#8 BGTKing

BGTKing

    Administrator

  • 7516 posts

Posted 19 February 2012 - 03:51 PM

I assume he recorded the time and measured the length, and divided the length by time.

I would plot all the average data on one plot as well.


#9 LaMbChOpZ

LaMbChOpZ

    Lead Particle Physicist and Musical Orchestrator

  • 2812 posts

Posted 19 February 2012 - 04:38 PM

Very interesting. They all look very similar.


The first 2 sections should look similar, since that was kept constant throughout the experiment. When I graph the averages sometime this week, you'll see that the 2 sections match up perfectly.

How did you record the velocitys?


I used photogates. I first put them at the beginning and end of the inversion, ran the inversion 3 times, then went to the beginning and measured them 2 at a time all the way down the set up, skipping the start and end of the inversion (since they were already tested).

Here's the photogates (middle picture)

Posted Image

I assume he recorded the time and measured the length, and divided the length by time.

I would plot all the average data on one plot as well.


I did indeed. 3.5, the length of the fin traveling through the digital timer, then found the time and divided, exactly like you said. I'm already a step ahead of you with graphing the averages (I've already got that slide started. It's a little hard to explain what I'm going to put on that slide, as far as lines denoting different sections of the track, but I will post an image when I finish. I did make an average's slide last year, and I plan to use that again this year.

Member of a few physics experiments; Orchestrator and/or Copyist for a few musicals.


#10 Jogumpie

Jogumpie

    Living through the great Gump hiatus...

  • 13586 posts

Posted 19 February 2012 - 06:19 PM

I don't suppose you have much time to manipulate the results, otherwise you could look into getting rid of measurements that are clearly wrong and using curve fitting for optimal results. The latter one is probably too much work for now, but I think you should get rid of wrong measurements anyway. Especially the zero-g roll, it has 6 measurements that I would throw out.


SSCoasters Administrator
The SSCoasters Forum Rules
DD_signature.jpg
YoutubeButton.pngFacebookButton.png


#11 LaMbChOpZ

LaMbChOpZ

    Lead Particle Physicist and Musical Orchestrator

  • 2812 posts

Posted 19 February 2012 - 08:31 PM

^ Our meet is March 3rd, so I have a bit of time. I can look into it, but I don't think manipulating my results is something I'm too crazy about. Yes it doesn't have any real effect on my project, but the reason it's like that (and because of the shape of the element). This has a direct effect on the exit velocity that it will cause the car to slow down more than other elements.

Member of a few physics experiments; Orchestrator and/or Copyist for a few musicals.


#12 Jogumpie

Jogumpie

    Living through the great Gump hiatus...

  • 13586 posts

Posted 20 February 2012 - 02:19 AM

I don't get you. Are you trying to justify the wrong measurements? These peaks in the graphs?


SSCoasters Administrator
The SSCoasters Forum Rules
DD_signature.jpg
YoutubeButton.pngFacebookButton.png


#13 Eggo

Eggo

    Vote for Pedro!

  • 1212 posts

Posted 20 February 2012 - 05:17 AM

I feel like the Zero g roll could have had a much better velocity if it was smoother and better supported.

Posted Image
|Millennium Force|TTD|El Toro|Bizarro|Maverick|Wildfire|Nitro|


#14 LaMbChOpZ

LaMbChOpZ

    Lead Particle Physicist and Musical Orchestrator

  • 2812 posts

Posted 20 February 2012 - 08:46 AM

I don't get you. Are you trying to justify the wrong measurements? These peaks in the graphs?


No, what I'm measuring is the difference in the entrance velocity and the exit velocity (2 red lines on the graph) of the car. This will show the "efficiency" (loosely fit) of the element to preserve velocity/energy.

I feel like the Zero g roll could have had a much better velocity if it was smoother and better supported.


How do you know it wasn't smooth? How do you know it didn't shake?

In fact, it was smooth and didn't shake, so there was no need to support something that didn't need the supports.

Member of a few physics experiments; Orchestrator and/or Copyist for a few musicals.


#15 Eggo

Eggo

    Vote for Pedro!

  • 1212 posts

Posted 20 February 2012 - 09:55 AM

I can see the bumps in it, and I would assume the track would bow a bit.

Posted Image
|Millennium Force|TTD|El Toro|Bizarro|Maverick|Wildfire|Nitro|


#16 LaMbChOpZ

LaMbChOpZ

    Lead Particle Physicist and Musical Orchestrator

  • 2812 posts

Posted 20 February 2012 - 10:12 AM

Well assuming can make an ass out of yourself. If you're so amazing and think you're perfect, find all of my errors right now. If not, shut up and go be pessimistic and discouraging somewhere else.

Member of a few physics experiments; Orchestrator and/or Copyist for a few musicals.


#17 RNB

RNB

    VV builder

  • 1808 posts

Posted 20 February 2012 - 10:22 AM

I'd make a first version with spikes, and a second with a corrected graph, without spikes. About the 0-G: It looks like it is braking BEFORE the end of the roll, while the train should be accelerating at that point.

It might be good to mention this in a report.


#18 Eggo

Eggo

    Vote for Pedro!

  • 1212 posts

Posted 20 February 2012 - 10:48 AM

Sorry, kind of in a bad mood today. Your project does look very nice, though. I found the results rather helpful. I wonder what the velocity is of a high speed turn...

Posted Image
|Millennium Force|TTD|El Toro|Bizarro|Maverick|Wildfire|Nitro|


Also tagged with one or more of these keywords: inversion, lambchopz, physics, pjas, velocity